The Subaru Outback entered the North American market in the mid 1990s during a period when wagons were beginning to lose popularity against SUVs and trucks. Subaru positioned the Outback as a lifted all wheel drive wagon designed for buyers who wanted SUV practicality without moving into larger truck based vehicles. That formula helped the Outback develop a loyal long term customer base, especially in colder regions across the United States and Canada where AWD capability became a major selling point. Over time, the Outback built one of the more stable resale profiles in the midsize crossover segment. Strong demand in snowbelt regions, high safety ratings, and predictable ownership costs continue supporting long term resale strength across multiple generations. The largest depreciation drop usually occurs during the first three years before values begin stabilizing more gradually. Well maintained AWD models generally retain value better than lower equipped trims because used buyers consistently prioritize all weather usability and safety features. An older Outback with clean service records often sells surprisingly fast. Especially right before winter arrives and everyone suddenly remembers snow exists again. The depreciation calculator helps buyers compare long term value retention across trims, mileage ranges, and ownership periods.
Ownership Period
Estimated Value Retained
1 Year
82% to 90%
3 Years
62% to 72%
5 Years
50% to 62%
10 Years
22% to 35%
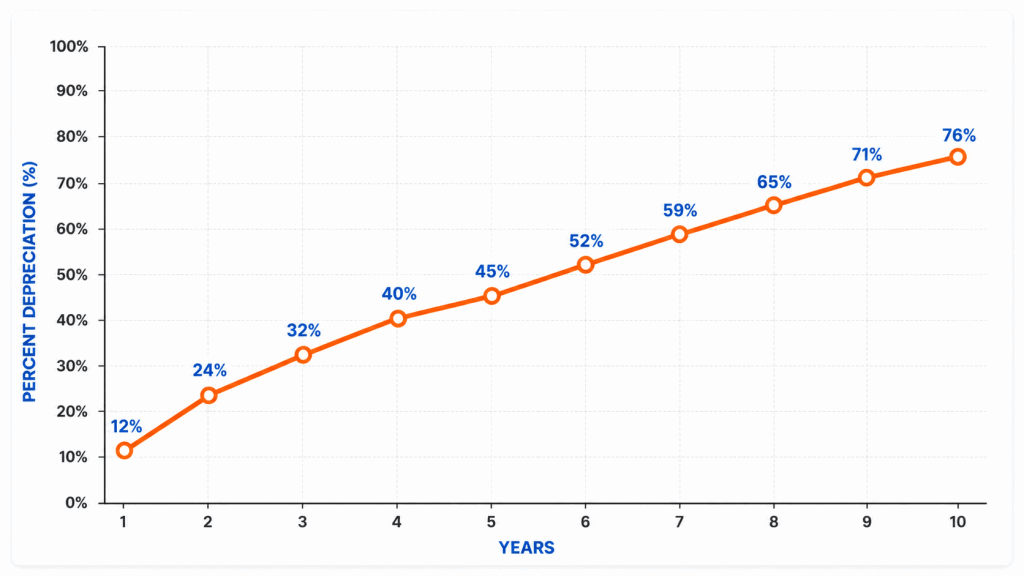
Depreciation Curve (1–10 Years)
The Subaru Outback follows one of the more stable depreciation curves in the midsize crossover market. The sharpest decline usually occurs between years one and three, when newer vehicles experience their highest percentage loss. After year five, depreciation slows noticeably as resale values stabilize for well maintained AWD models with documented service history.
Several market shifts helped strengthen Outback resale demand over time. During the late 2000s and early 2010s, consumer demand moved heavily toward crossovers as traditional sedans and wagons declined in popularity across North America. Subaru benefited from that transition because the Outback already combined wagon practicality with SUV styling and standard AWD capability. The used vehicle market changed again during 2020 through 2022 when inventory shortages and semiconductor supply disruptions increased used vehicle prices across the industry. AWD crossovers with strong fuel economy became especially difficult to find, temporarily improving resale values for many Outback trims. Using the ownership cost calculator alongside depreciation estimates helps buyers understand how long term value loss affects overall ownership expenses.
Vehicle Age
Estimated Depreciation
1 Year
10% to 18%
3 Years
28% to 38%
5 Years
38% to 50%
7 Years
52% to 65%
10 Years
65% to 78%
Depreciation by Trim
Trim level significantly affects how the Subaru Outback holds value over time. Base models generally depreciate faster because used buyers often prioritize additional safety systems, upgraded interiors, and larger feature packages. Mid and upper trims usually maintain stronger resale demand because they balance practicality with comfort and technology. Limited, Touring, and Wilderness models typically retain value more effectively due to stronger feature content and higher buyer demand in the used market. Features such as larger center screens, upgraded seating materials, panoramic roofs, and advanced driver assistance systems help older Outbacks remain competitive against newer crossovers. The Wilderness trim introduced during the sixth generation also created a unique resale position because it targeted buyers interested in outdoor travel and light off road capability. Subaru leaned heavily into adventure focused marketing during the early 2020s as outdoor recreation demand increased after the pandemic period. Suddenly everyone wanted roof racks, camping gear, and mountain photography skills. Comparing trim specific value loss through the depreciation calculator often reveals major resale differences between trims from the same model year.
Outback Trim
Estimated 5 Year Depreciation
Base
42% to 50%
Premium
38% to 47%
Limited
35% to 45%
Touring
33% to 43%
Wilderness
34% to 44%
Depreciation by Model Year
Recent Subaru Outback model years generally retain value better than older generations because safety systems, fuel efficiency, and cabin refinement improved steadily throughout the late 2010s and early 2020s. Subaru expanded driver assistance technology significantly during this period while updating engine efficiency and interior quality to remain competitive against newer midsize crossovers. The sixth generation launched for the 2020 model year on Subaru’s updated global platform with improved structural rigidity, revised suspension tuning, and expanded safety technology. These updates strengthened resale demand because buyers viewed the newer models as safer and more refined than earlier generations. The 2024 through 2022 model years currently maintain the highest retained value percentages because they combine modern safety systems with relatively low mileage. Older model years continue holding moderate resale value when maintenance history remains consistent and accident history stays clean. Buyers in the used market usually trust organized service records more than sales listings that describe every vehicle as “rare.” Reviewing resale timing through the trade in value estimator helps compare how quickly different Outback model years lose value.
Model Year
Estimated Value Retained
2024 to 2022
68% to 76%
2021 to 2019
55% to 65%
2018 to 2016
42% to 52%
2015 to 2013
30% to 40%
Depreciation by Generation
Generational updates significantly influence how the Subaru Outback holds value because changes in platform design, safety systems, efficiency, and technology all affect long term used market demand. The fourth generation released during 2010 improved interior space and ride quality, though older safety systems and aging technology reduce resale strength today. The fifth generation introduced in 2015 improved efficiency, driver assistance systems, and crash performance while helping Subaru expand sales significantly during the crossover market boom. The sixth generation launched for 2020 on Subaru’s global platform with upgraded structural rigidity, updated EyeSight safety systems, revised suspension tuning, and improved cabin refinement. These changes strengthened resale demand because the newer Outback aligned more closely with modern crossover expectations. Broader industry trends also influenced depreciation behavior across each generation. Fuel price increases, changing family vehicle preferences, and stronger outdoor lifestyle marketing all helped maintain long term Outback demand. At some point the Outback quietly became the unofficial vehicle of hiking trail parking lots everywhere. Using the ownership cost calculator alongside depreciation estimates helps buyers compare long term value between generations more accurately.
Outback Generation
Resale Strength
6th Generation 2020 to Present
Strong
5th Generation 2015 to 2019
Moderate to Strong
4th Generation 2010 to 2014
Moderate
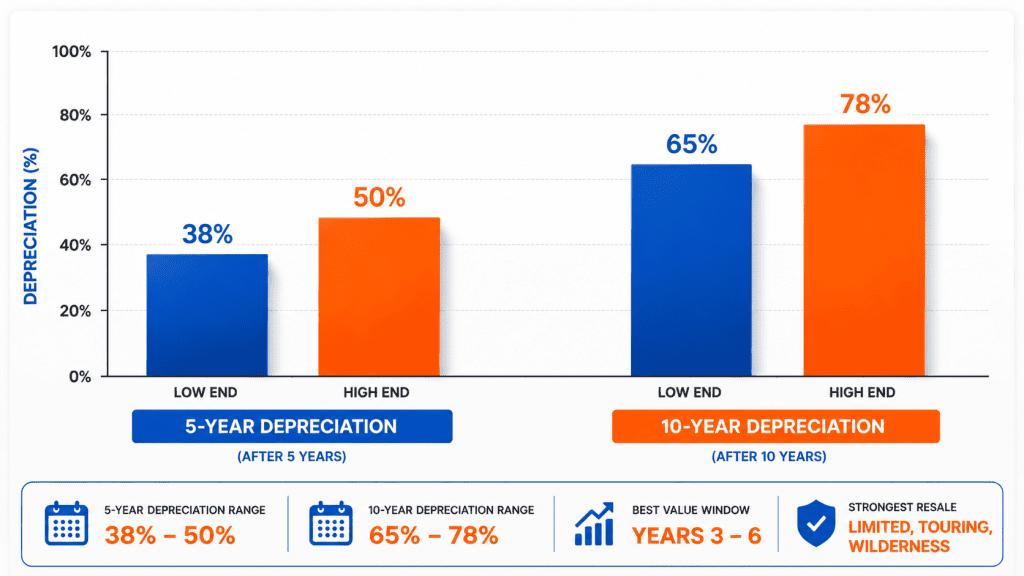
Depreciation Metrics and Value Indicators
Several long term value indicators help explain why the Subaru Outback remains one of the more stable midsize crossovers for resale retention. Five year depreciation generally lands between 38% and 50%, while ten year depreciation commonly reaches between 65% and 78% depending on mileage, trim level, condition, and regional demand.
The strongest ownership value window typically falls between years three and six. During this period, depreciation slows noticeably while purchase prices become far more affordable than newer models. Buyers often target this range because it balances lower purchase costs with modern safety systems and updated interior technology. Limited, Touring, and Wilderness trims usually maintain the strongest resale demand due to broader equipment levels and strong AWD crossover demand in colder climates. Fuel efficiency and predictable ownership costs also help stabilize long term value as vehicles age. Combining estimates from the depreciation calculator and ownership cost calculator gives buyers a broader understanding of long term financial value and resale timing.
Value Indicator
Estimated Range
5 Year Depreciation
38% to 50%
10 Year Depreciation
65% to 78%
Best Value Window
Years 3 to 6
Strongest Resale
Limited, Touring, Wilderness
Subaru Outback Depreciation FAQ
Most Rogue models lose 40% to 50% of their value within the first five years depending on trim, mileage, and drivetrain.
AWD SL and Platinum models usually retain value the strongest due to higher equipment levels and stronger used market demand.
Yes. The 2021 redesign improved efficiency, safety performance, and technology, helping newer models maintain stronger resale value.
Yes. Predictable depreciation, fuel efficiency, and stable ownership costs make the Rogue a strong long term value choice.
Conclusion
The Nissan Rogue maintains relatively steady depreciation compared to many compact SUVs, especially on AWD mid level and premium trims. Fuel efficiency, strong safety performance, and broad used market demand help support stable resale value across multiple generations. Newer Rogue models currently hold value best due to improved technology, updated safety systems, and refined efficiency. Older models continue providing moderate resale stability when maintained properly and kept in good condition. Across recent generations, the Rogue remains one of the more financially predictable compact SUVs for buyers focused on long term ownership planning and manageable depreciation behavior.
This platform analyzes depreciation trends, resale value behavior, and long-term ownership costs, helping drivers understand how mileage, maintenance, and timing shape real financial outcomes.