Cost stability defines the ownership experience of the Toyota RAV4 more than any single feature. Instead of unpredictable spikes, expenses are spread across depreciation, fuel, and routine servicing in a way that remains manageable over time. Long term ownership data shows many RAV4 models surpass 150000 miles with relatively low repair frequency when maintenance is followed. Hybrid variants further reduce operating costs through improved efficiency, while strong resale value limits depreciation losses by roughly 5% to 10% compared to segment averages. Buyers analyzing full ownership impact can use the ownership cost calculator to model real world expenses.
What This Ownership Cost Guide Covers
Understanding ownership costs requires more than listing expenses. This guide focuses on how costs behave over time, not just what they are. Coverage includes maintenance, repairs, insurance, fuel, depreciation, and long term cost shifts. Each category reflects real ownership patterns, including how reliability, efficiency, and resale value influence total spending. The objective is to show what ownership actually looks like over 5 to 10 years rather than relying on static estimates.
Annual Ownership Costs Explained
Looking at annual costs reveals how evenly the RAV4 distributes financial load across categories. No single category dominates completely, which reduces risk for owners.
Cost Category
Annual Trend
Notes
Maintenance
Low
Predictable service intervals
Repairs
Low early, moderate later
Most occur after 100000 miles
Insurance
Below average
Strong crash safety ratings
Fuel
Low to moderate
Hybrid models reduce costs
Depreciation
High early
Slows after year 3
Taxes & Fees
Stable
No unusual increases
Depreciation typically accounts for 40% to 50% of total ownership cost in early years, while fuel and insurance remain consistent contributors. This balanced structure prevents sudden cost spikes, which is one of the main reasons the RAV4 is considered a low risk vehicle to own long term.
Year by Year Cost Breakdown 1 to 10 Years
Cost distribution shifts gradually as the vehicle ages. Early ownership is dominated by depreciation, while later years introduce maintenance and repair expenses.
Year Range
Primary Cost Driver
Secondary Cost
1 to 3
Depreciation
Insurance
4 to 5
Depreciation + Fuel
Maintenance
6 to 8
Maintenance + Repairs
Fuel
9 to 10
Repairs
Maintenance
Depreciation slows significantly after year 3, reducing annual ownership cost for long term owners. After year 5, maintenance becomes more noticeable, though still predictable. This transition is important because it allows owners to plan expenses rather than react to unexpected costs.
Maintenance & Repair Costs
Service consistency plays a major role in keeping ownership costs low. Most RAV4 maintenance revolves around routine items rather than major repairs.
Service Type
Typical Mileage
Cost Range
Brake Service
60000 to 90000 miles
$300 to $800
Suspension Components
100000+ miles
$400 to $1200
Cooling System Service
Around 100000 miles
$150 to $500
Repair probability remains low before 100000 miles, with most issues categorized as low to moderate severity. Hybrid models extend brake life by up to 30% to 50% due to regenerative braking, which reduces both service frequency and cost. This helps keep total maintenance expenses lower than many competing vehicles. Drivers can estimate unexpected repair scenarios using the repair cost estimator.
Insurance Costs
Insurance pricing remains one of the quieter advantages of owning a RAV4. Strong crash test ratings and low injury claim rates directly influence premiums.
Fuel efficiency directly affects how much the vehicle costs to operate year after year. This is where hybrid models create a measurable advantage.
Driving Type
Gas Model MPG
Hybrid MPG
City Driving
27 to 30 MPG
38 to 41 MPG
Highway Driving
33 to 35 MPG
35 to 38 MPG
Combined
30 to 32 MPG
39 to 41 MPG
The difference is most noticeable in city driving, where hybrids can reduce fuel consumption by roughly 25% to 35%. At 12000 miles per year, this translates to approximately $300 to $700 in annual savings depending on fuel prices. Over 5 years, that can offset a significant portion of ownership costs. You can calculate your personal fuel spending using the fuel cost calculator based on your annual mileage.
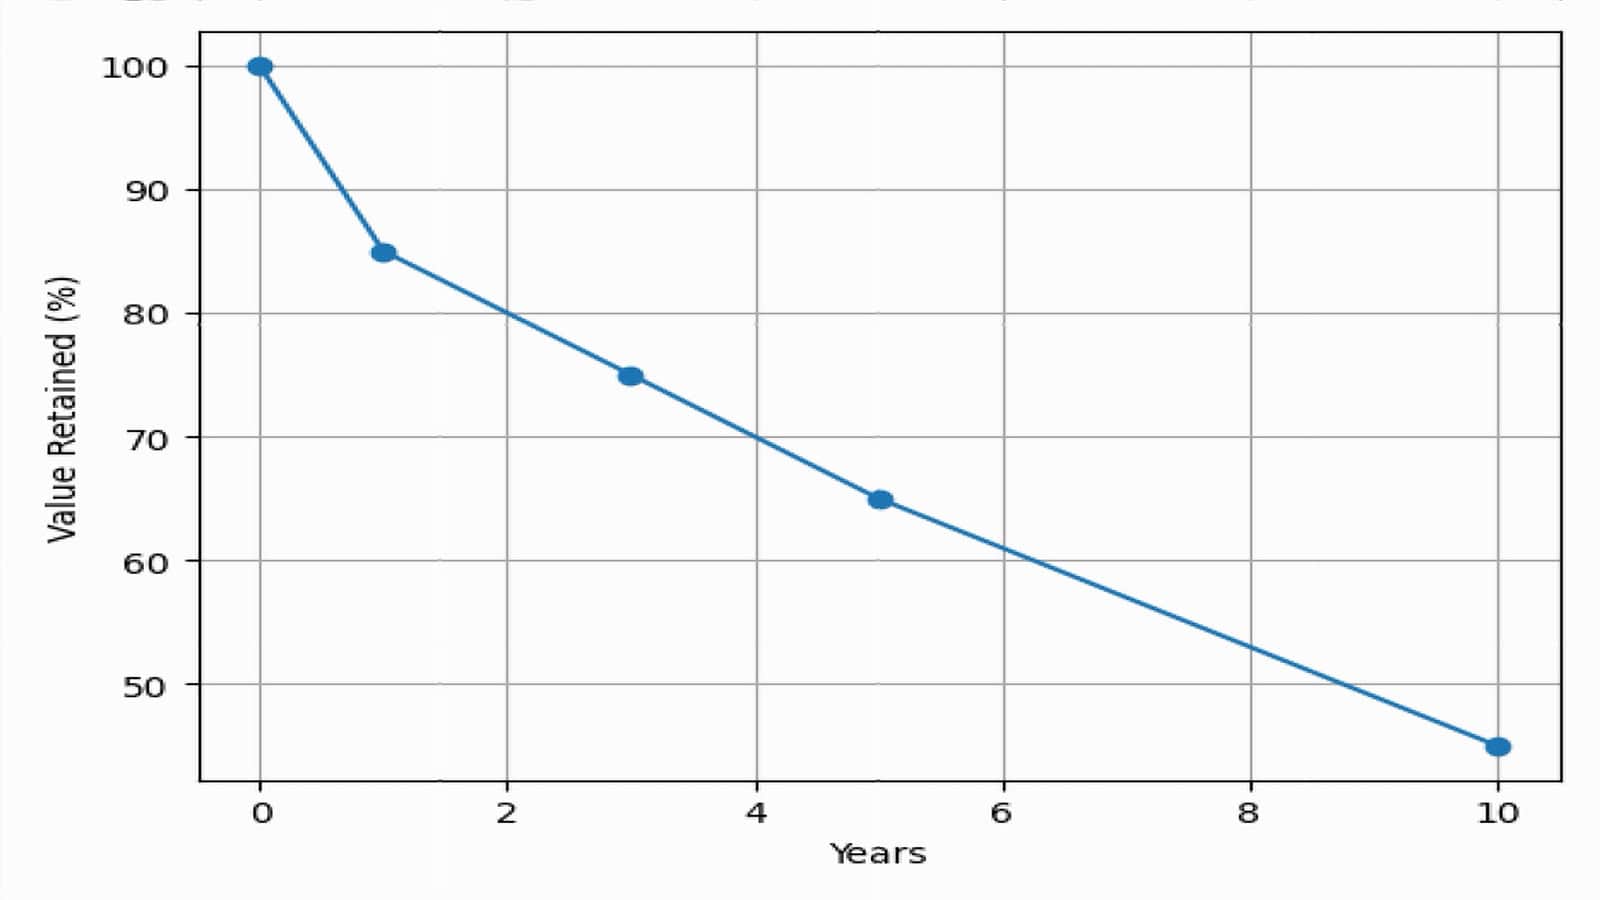
Depreciation Curve
Resale value plays a major role in determining total ownership cost. The RAV4 performs strongly here, which reduces long term financial loss.
Long term value trends can be explored further with the car depreciation calculator. This helps estimate how different ownership periods and mileage levels impact resale value over time.
Cost Comparison vs Competitors
Positioning against competitors shows where the RAV4 stands financially within its segment.
Vehicle
Maintenance Cost
Fuel Cost
Depreciation
Toyota RAV4
Low
Low
Low
Honda CR-V
Low
Moderate
Moderate
Nissan Rogue
Moderate
Moderate
Moderate
Ford Escape
Moderate
Higher
Higher
Lower fuel costs and stronger resale value give the RAV4 a measurable advantage over time. While competitors may match it in one category, few match it across all three major cost drivers.
Depreciation accounts for roughly 45% of total cost during this period. Maintenance remains low, and most owners experience minimal unexpected expenses, which makes budgeting predictable.
Repair costs increase after 100000 miles, but remain manageable compared to many competitors. This gradual increase prevents sudden financial strain, which is a key factor in long term ownership satisfaction.
How to Reduce Ownership Costs
Cost control depends more on consistency than major changes. Small habits make a noticeable difference over time.
Maintain scheduled service intervals
Use high quality fluids
Keep tires properly inflated
Compare insurance quotes annually
Drive smoothly to improve fuel efficiency
Following these steps can reduce long term ownership costs by 10% to 20% depending on driving habits and maintenance discipline.
Is the Toyota RAV4 Expensive to Own
Overall ownership cost stays below average for the compact SUV segment. Strong resale value, efficient powertrains, and low repair frequency keep expenses controlled. Drivers looking for predictable long term costs often choose the RAV4 because it avoids the cost spikes seen in less reliable vehicles.
Depreciation is the largest expense, especially during the first 3 years of ownership.
Yes. It retains value better than most compact SUVs, with hybrids performing even stronger.
No. Most repairs are moderate in cost, and major failures are uncommon before high mileage.
Yes. Insurance rates are generally lower due to strong safety performance and low claim severity.
Conclusion
Ownership cost predictability is where the RAV4 stands out most. Instead of uneven expenses, costs remain balanced across depreciation, fuel, and maintenance. Buyers focused on long term value benefit from strong resale performance, efficient operation, and low repair frequency. Over 5 to 10 years, the RAV4 consistently ranks among the most cost effective vehicles in its class.
This platform analyzes depreciation trends, resale value behavior, and long-term ownership costs, helping drivers understand how mileage, maintenance, and timing shape real financial outcomes.